.svg)
3,166 Impressions and 3 Clicks Changed How We Built an SEO Content Strategy
One query recorded 3,166 impressions and 3 clicks. We separated query evidence from page performance before deciding what the SEO content strategy needed to change.
One query made our SEO content strategy look simpler than it was
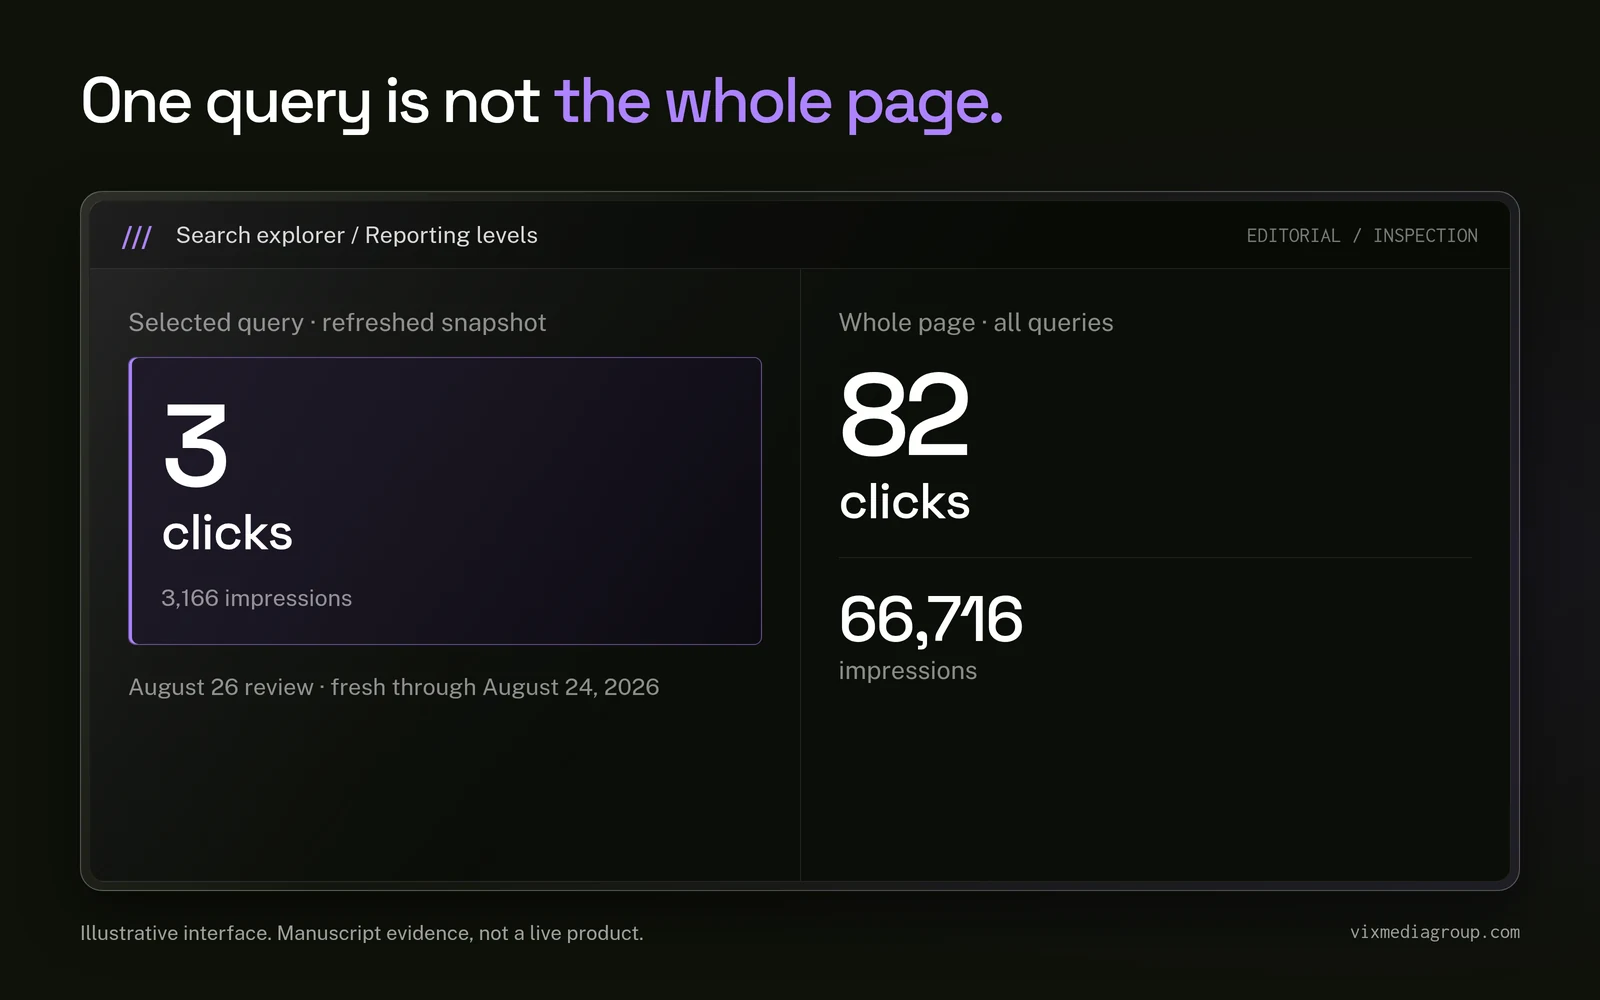
An SEO content strategy needs page-level and query-level evidence to stay separate. In an August 26, 2026 search review, we found one informational query with 3 clicks and 3,166 impressions in the refreshed Google Search Console snapshot. Its average position was 8.355.
Our search engine optimization services began by correcting the reporting level. The 3 clicks belonged to one query, not the article as a whole. The full page had 82 clicks and 66,716 impressions across all queries in the same current page-level window.
That distinction changed the operating question. We were not looking at a page with only 3 clicks. We were looking at one highly visible query that contributed very little traffic inside a page with a much broader search footprint.
What did the 3,166-impression query actually show?
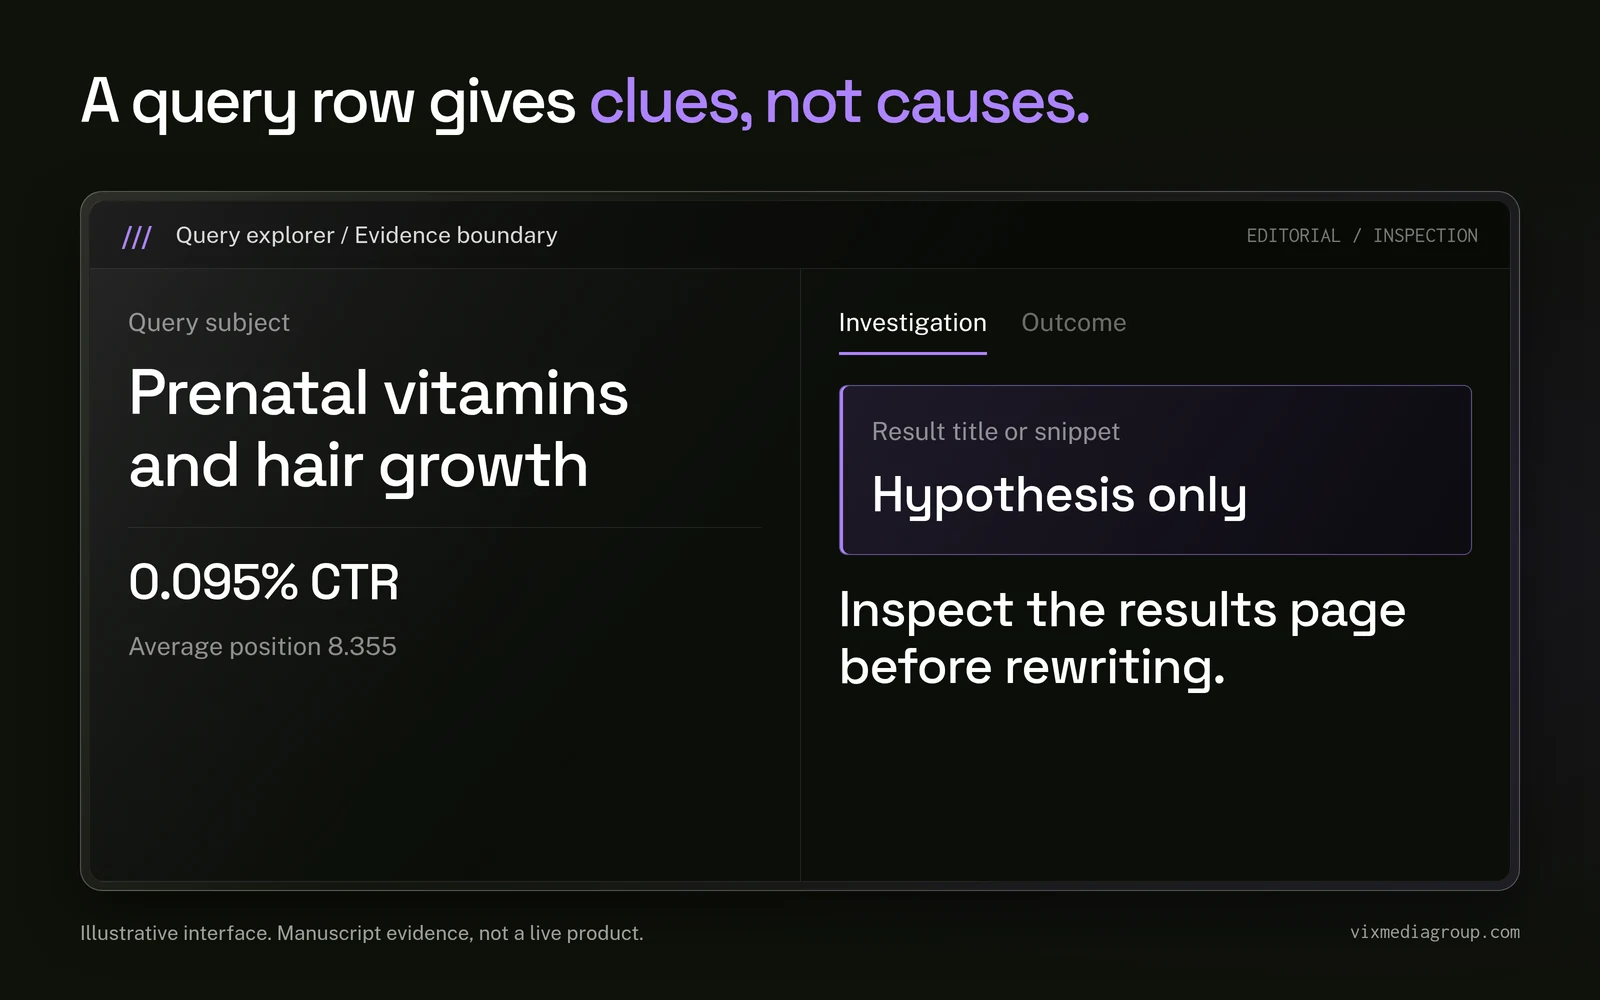
The query showed that one informational term appeared frequently and produced a 0.095 percent click-through rate in the snapshot. It concerned whether prenatal vitamins help with hair growth.
We can report the observed impressions, clicks, average position, and query subject. We cannot infer why each searcher did or did not click from a Search Console row.
The archived and refreshed totals needed different labels
An earlier point-in-time export recorded 3,162 impressions and 3 clicks. The refreshed row showed 3,166 impressions and the same 3 clicks when the source was checked, with Google Search Console freshness through August 24, 2026.
We use 3,166 in the title because it matches the refreshed evidence in the publication ledger. If the earlier 3,162 value is ever used, it must remain attached to its archived export rather than presented as the current row.
Query performance could not stand in for page performance
The page-level total was much larger because the article appeared for more than one query. Saying that the article received only 3 clicks would have collapsed a single query row into the entire page.
This is a common analytical error because dashboards place page and query tables near each other. The units can look similar while answering different questions:
- A query row describes performance for one search term.
- A page row combines performance across the queries associated with one URL.
- A site row combines pages and queries within the selected property and period.
We preserved those levels before recommending any content change.
Why was the obvious click-through explanation incomplete?
The obvious explanation was that the title or snippet failed. That was possible, but the available record did not prove it.
Several hypotheses could explain low click-through at that observed position:
- The visible result title may not have matched the searcher's preferred answer.
- Search features may have satisfied part of the question before a click.
- Competing results may have made a clearer promise.
- The query may have reflected research rather than immediate commercial intent.
- The result may have appeared differently across devices, locations, or moments.
These are testable explanations, not conclusions from the row. We would need results-page inspection, title history, device and country segmentation, and controlled changes before assigning a cause.
Visibility did not automatically mean commercial capture
The query was informational. It could introduce the brand, support topical coverage, or answer an early-stage question, but an impression did not indicate a service inquiry.
We also observed local commercial queries that ranked lower and generated limited clicks. That contrast suggested an allocation issue worth investigating. The site could be visible around educational questions while remaining weak where local customers expressed service intent.
Our website migration SEO recovery shows why we inspect technical structure alongside content. A page cannot carry commercial intent effectively when routing, internal links, or indexable architecture remain unstable.
The data revealed that the page had more than one job
The article's broader page-level performance showed that it attracted visibility across a larger query set. The single 3-click query was not a verdict on the page. It was one clue about how the page participated in the search journey.
We separated three possible jobs:
- Answer the informational question accurately and clearly.
- Establish a useful connection to the site's subject expertise.
- Give interested visitors a relevant next step without turning education into a treatment promise.
For healthcare brands, our healthcare marketing experience helps us keep those jobs distinct. Educational content should not manufacture urgency, imply an outcome, or force a commercial claim that the evidence cannot support.
Intent classification came before rewriting
We classified queries as informational, comparative, local, or transactional. Then we matched each group to the page best equipped to satisfy it.
A broad educational article may deserve refinement when it earns impressions without enough relevant clicks. A local service query may need a focused service or location page instead. Combining both intents on one page can weaken the answer for each audience.
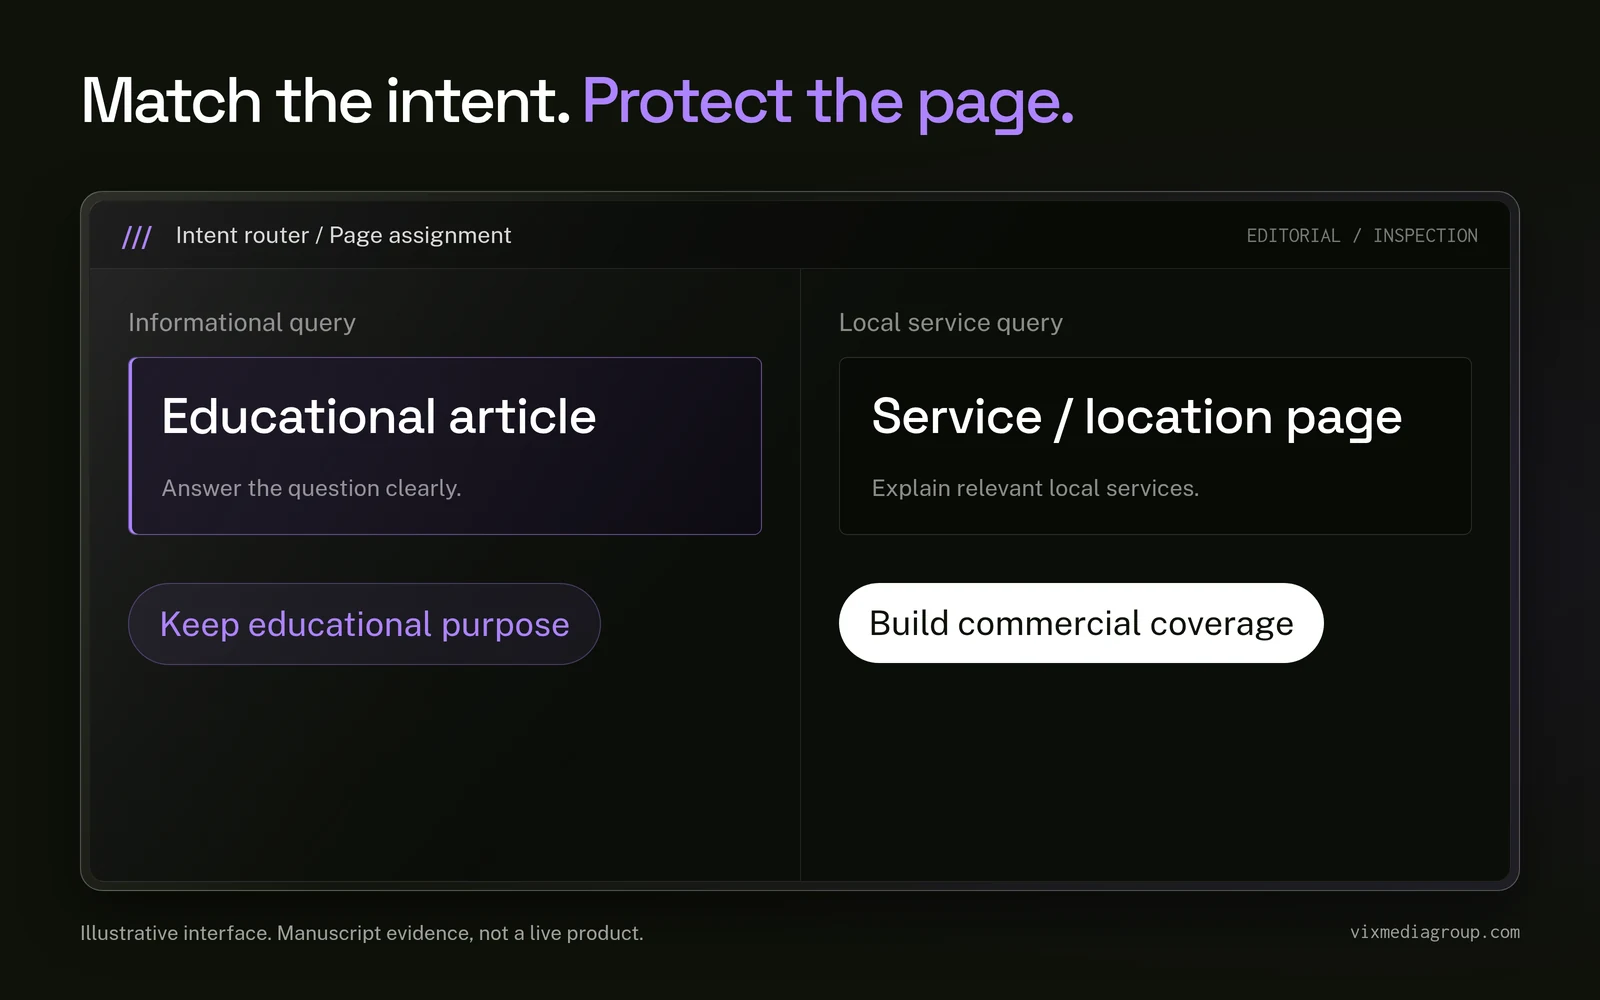
The intent map prevented us from rewriting a successful educational page into a poor local landing page. It also showed where the site needed stronger commercial coverage rather than more informational volume.
What did we change in the review process?
We turned the finding into a four-layer content review. The process moved from reporting accuracy to page purpose before any editorial recommendation.
The four layers were:
- Separate site, page, and query totals.
- Classify the query set by intent and geography.
- Match each intent group to the correct page type.
- Connect educational visibility to a useful, measured next action.
We also recorded data freshness and the exact row used in the discussion. Query totals can change as the reporting window and source refresh, so the number needs a date and level every time it appears.
Measurement followed the same intent map
A Search Console impression is not a visit. A click is not a lead. A lead is not a conversion or revenue event.
Our attribution tracking services connect landing pages, on-site actions, CRM records, and business outcomes while keeping those stages separate. The system can show progression when identifiers and definitions support it. It cannot turn visibility into revenue by relabeling the metric.
The same measurement discipline applies to emerging discovery channels. A citation, impression, referral, lead, and sale belong to different evidence planes.
What happened next is a diagnosis, not a measured content win
The evidence supports a precise diagnosis. One query generated 3 clicks from 3,166 impressions at an average position of 8.355, while the full page generated 82 clicks and 66,716 impressions across its query set in the current page-level window.
The record does not establish that a rewrite increased clicks, that informational visibility created leads, or that the query caused any revenue result. The phrase changed our strategy describes our interpretation and planning response, not a measured performance outcome.
We also keep the client anonymous because the query, page subject, and performance combination could identify the account. Publication approval remains required for the internal figures.
What would we do differently in the next Search Console review?
We would build the reporting hierarchy into the first export. Every screenshot, table, or memo would label the property, page, query, period, freshness date, and dimension before the number reached an editorial meeting.
Our next review checklist would require teams to:
- Confirm the selected property and reporting dates.
- Label page totals and query rows separately.
- Preserve the data freshness date and export.
- Segment leading terms by intent, geography, device, and country where useful.
- Inspect the live results page before changing titles or snippets.
- Map each intent to the page meant to serve it.
- Track the next on-site action in a separate measurement layer.
Teams can use the Vix marketing audit to identify where search visibility, page purpose, and commercial measurement have become disconnected.
How Vix builds SEO content strategy from honest denominators
Vix connects query analysis, page architecture, editorial work, technical execution, and measurement. We start by naming what each number represents because the strategy fails when one reporting level borrows the meaning of another.
The 3,166-impression query did not prove that the page failed. The 82-click page total did not prove that the page created customers. Together, the rows showed a broad educational asset containing one visible query with a weak observed click rate.
That was enough to improve the plan. We could protect the educational purpose, investigate the search result, strengthen the appropriate next action, and build separate local commercial coverage where the evidence supported it.
An SEO content strategy becomes useful when it preserves those boundaries. It should explain what was visible, what people clicked, what the page was built to do, and what evidence is still needed before visibility can be called business value.

.svg)



Do you remember the last caption you read on Instagram last night? What was the last reel you watched on Facebook about? If you cannot answer one of these questions, you’re not alone. There's plenty of content online, from Google search results to social media posts and how-to videos and articles.



Start Growing Your Dental Practice with SEO
Take the first step toward transforming your marketing. Whether you’re looking to boost engagement, improve your online presence, or grow your business, our team at Vix Media Group is here to help.
Let’s craft a strategy tailored to your goals.